[ UPDATE 10/07/2021 21:29 ]: JENDELA Map is now accessible. You can view the map here.
===
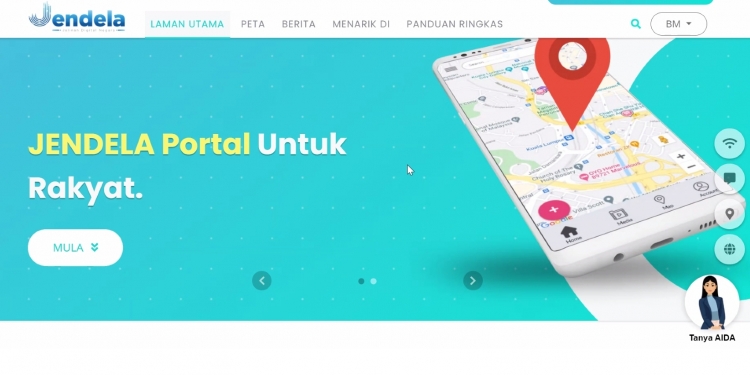
As promised last year, the Malaysian Communications and Multimedia Commission (MCMC) has launched the JENDELA Map which allows Malaysians to find out what telco services are available in their area. On top of that, if the desired service is not available, users are able to submit a new service demand and MCMC work with the respective telcos to expedite the request.
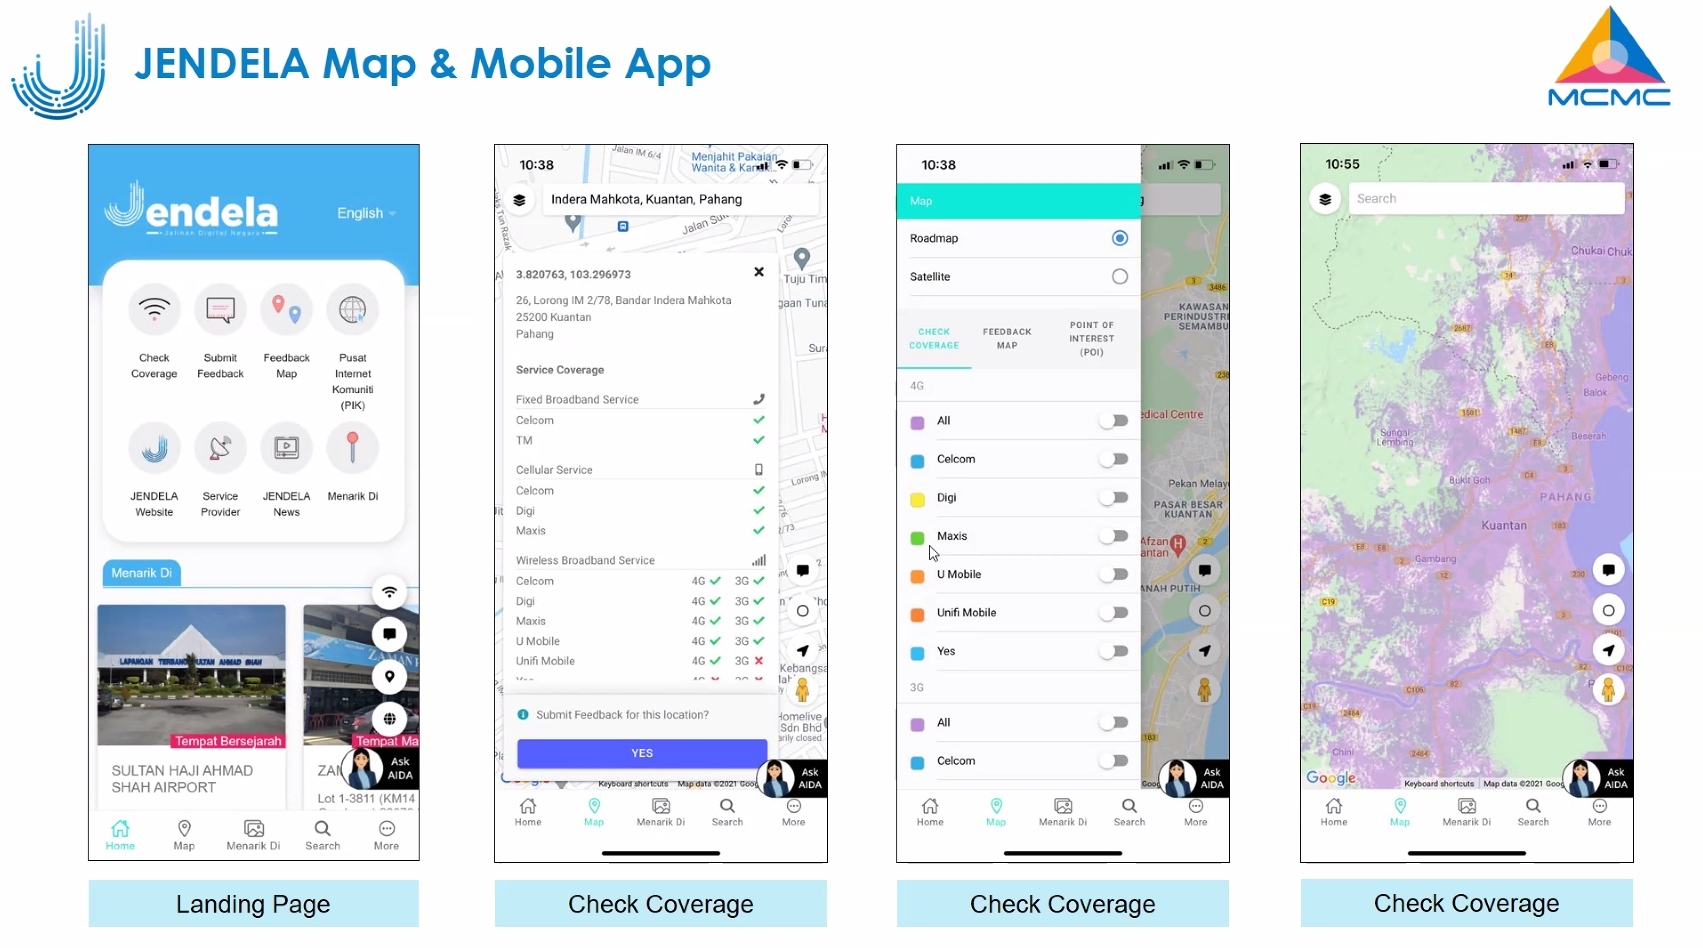
According to Communications and Multimedia Minister Dato Saifuddin Abdullah, the JENDELA Map is a one-stop-centre for the people to check their coverage area, to provide feedback and to submit a service request. At the moment, the map is only available on the web which is accessible at jendela.my. The MCMC has revealed that a mobile app version will be released soon.
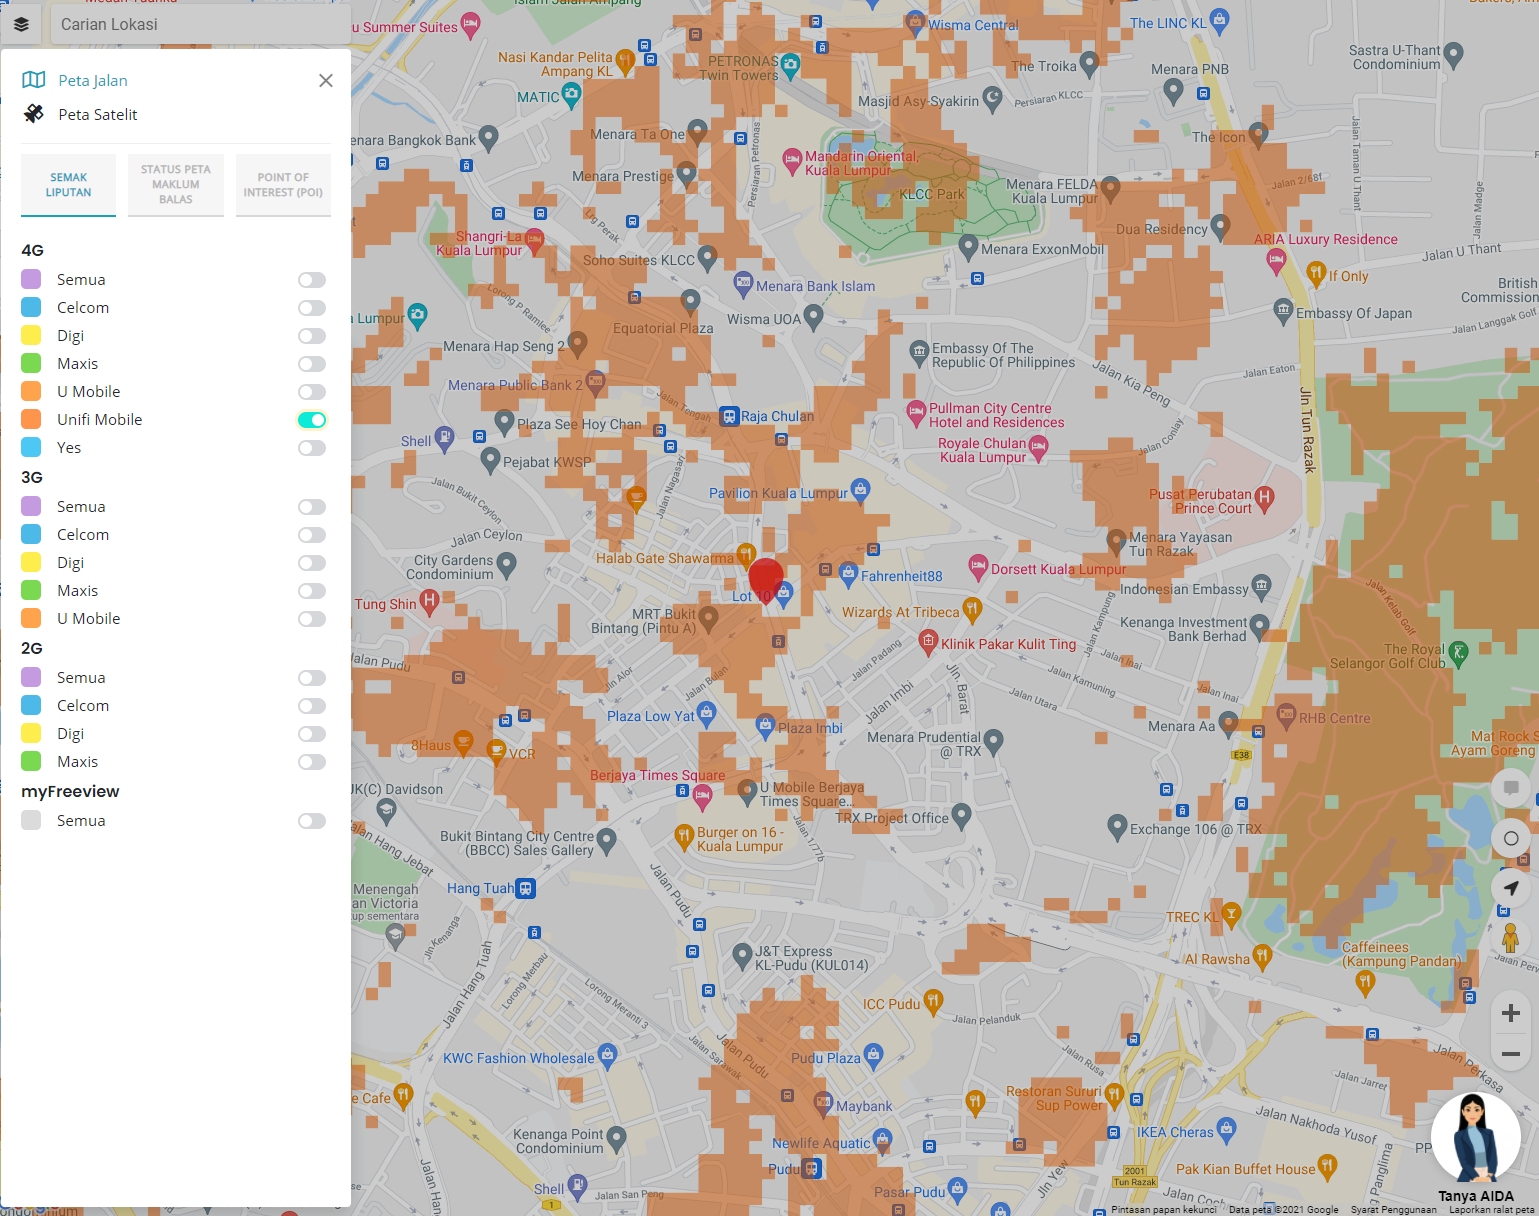
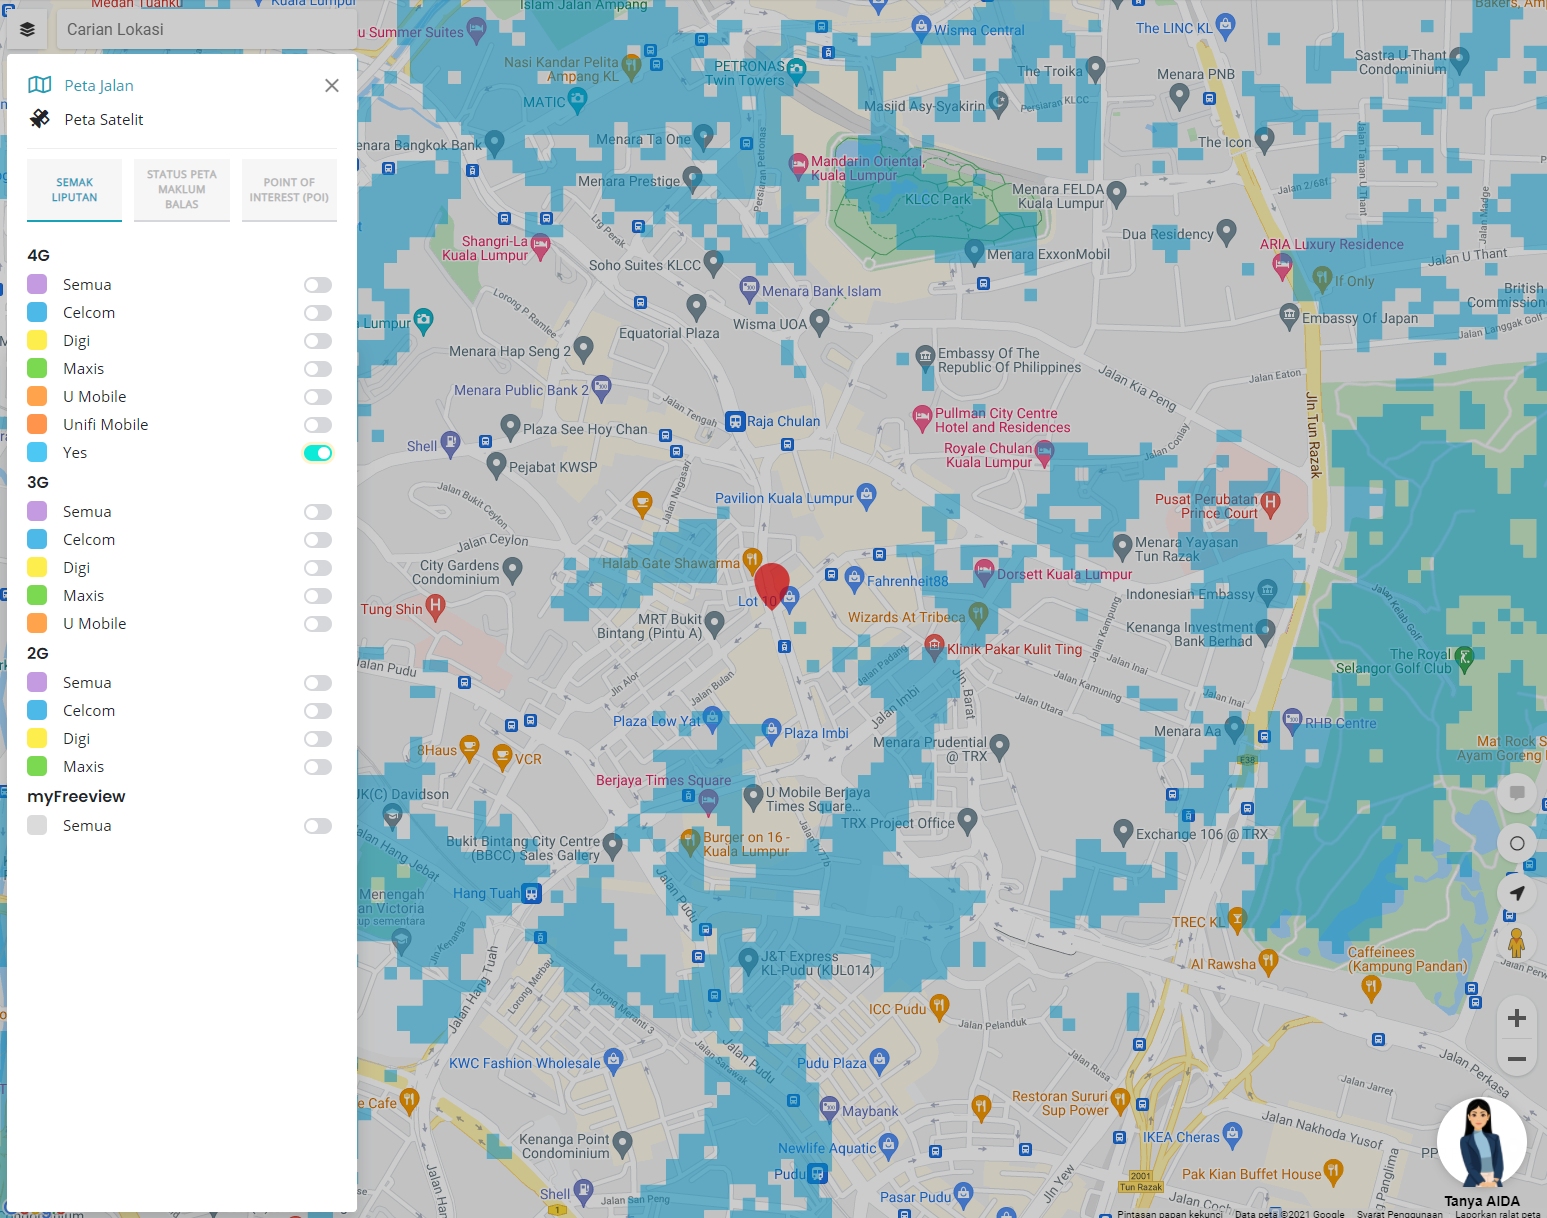
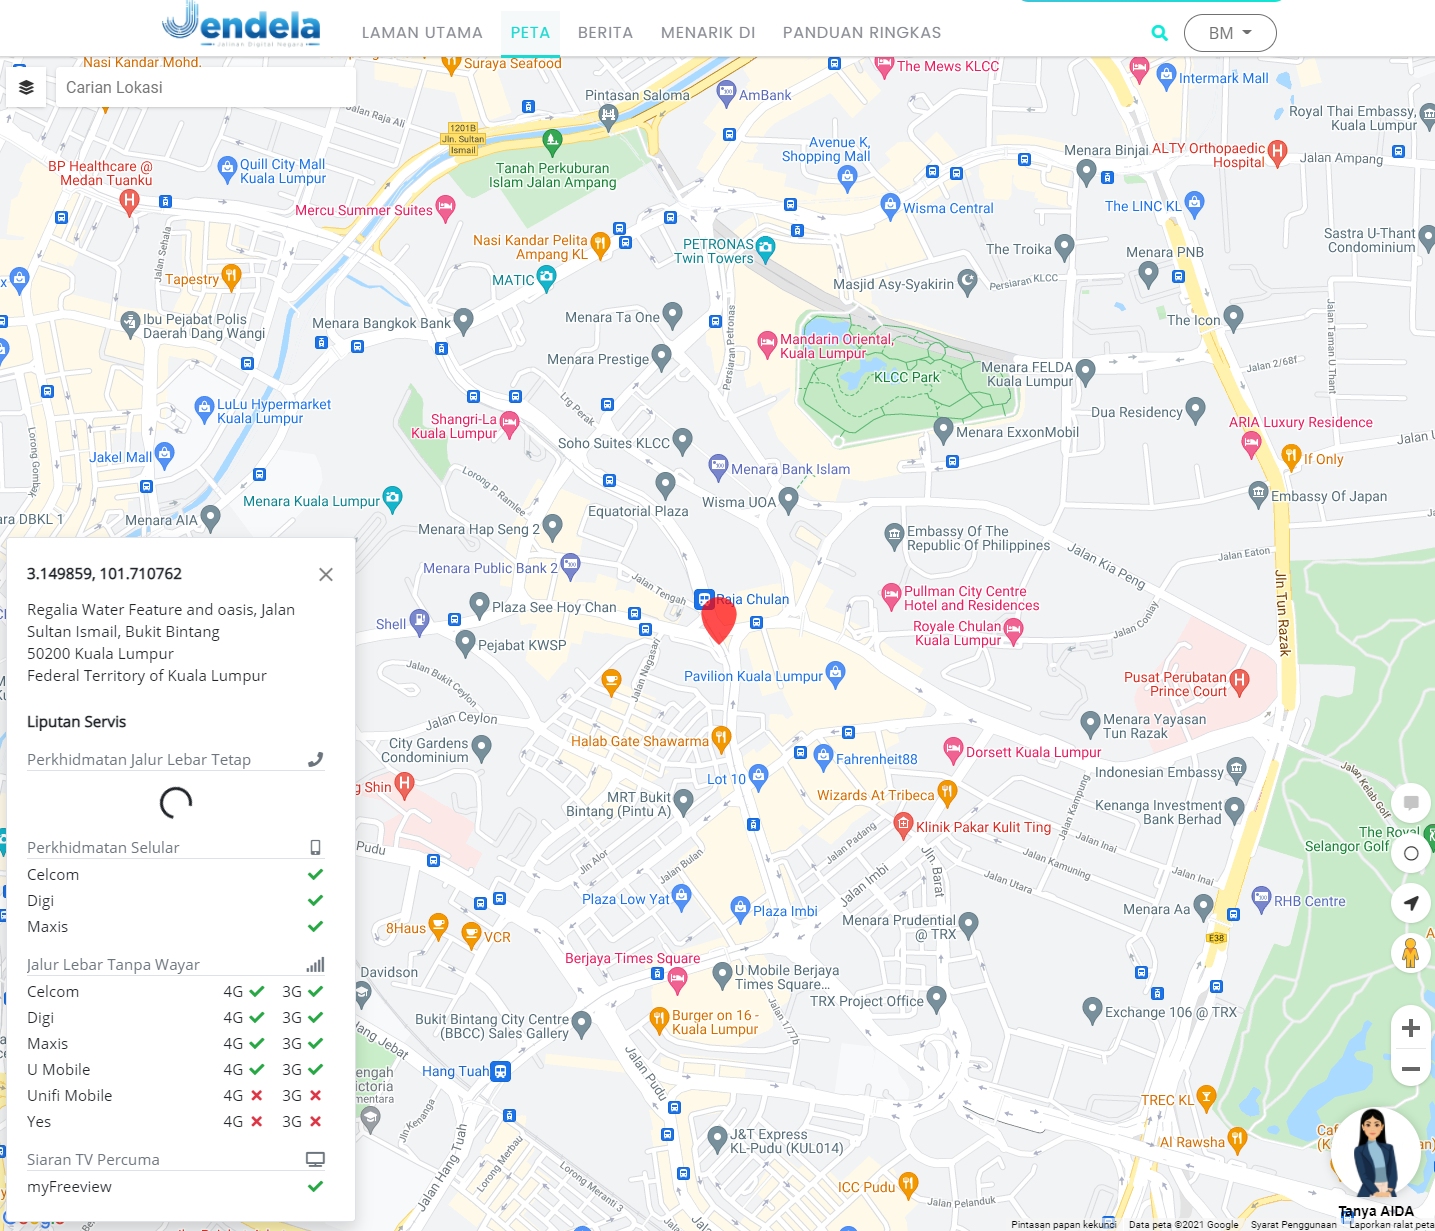
At a quick glance, it looks like a copy of the Opensignal map which plots coverage data of all mobile operators as well as Digital TV signal coverage. You can search or drop a pin to find out what services are available. The map only gives basic info by giving a tick if there’s coverage or a cross where it isn’t available.
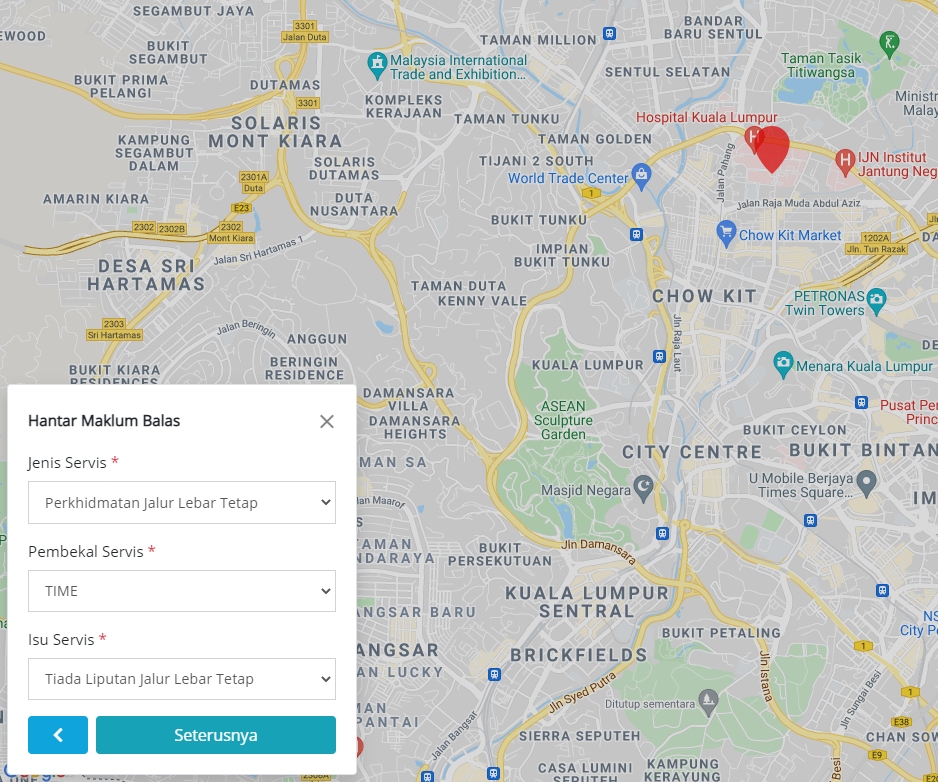
Users can also provide feedback on service issues such as drop calls, service disruption, or poor coverage. If you need help, there’s also AIDA, an AI-assisted helpdesk.
From our short experience, it appears that the coverage map data isn’t that accurate. For Yes and U Mobile, the plotted coverage is very little which gives the impression that their coverage is not available in most places. As shown in the screenshot above, it indicated that Unifi Mobile and Yes are not available in Bukit Bintang when in reality, both telcos do have coverage in the area.
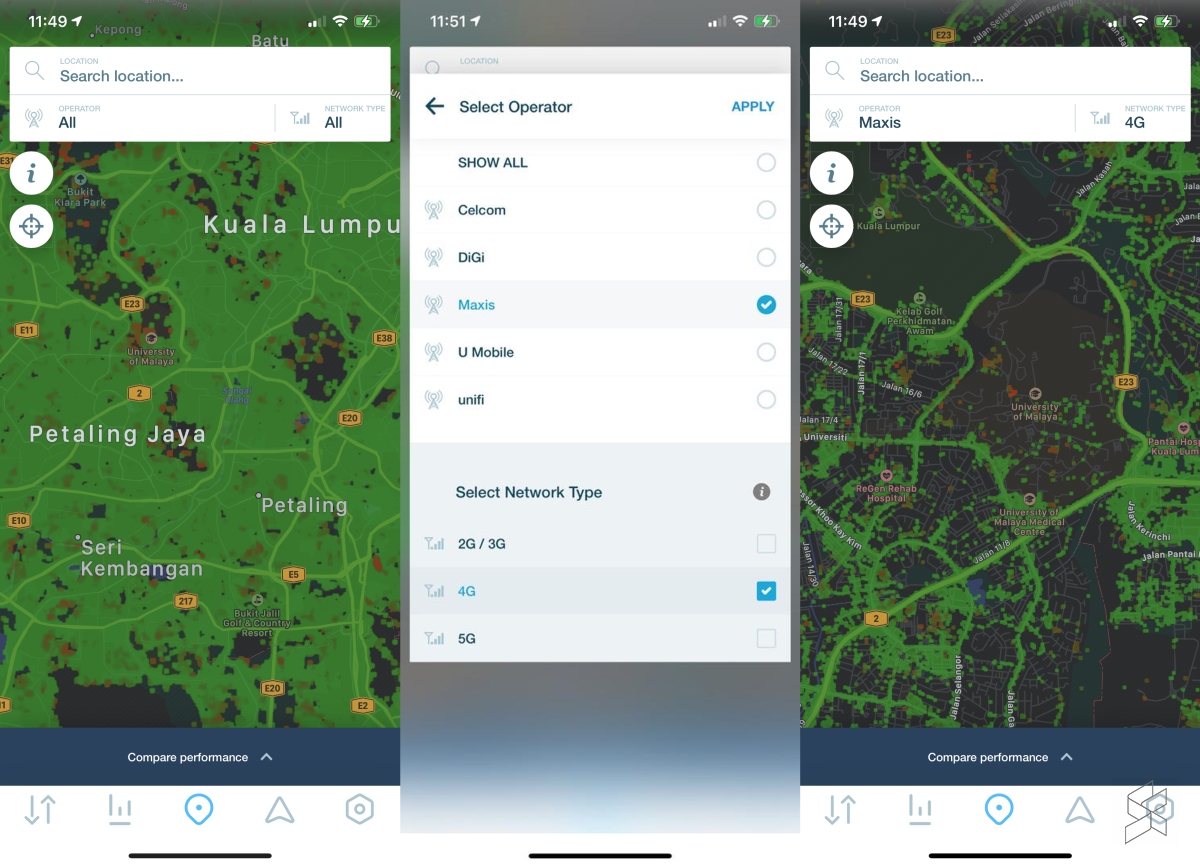
Besides showing the coverage map, what’s missing is the performance data that Opensignal provides. It would be useful for consumers to find out which telco provides the best performance at their location. This would be crucial as not all telcos provide the same experience. If you toggle to a telco, Opensignal’s coverage map will highlight poor signal areas in red.
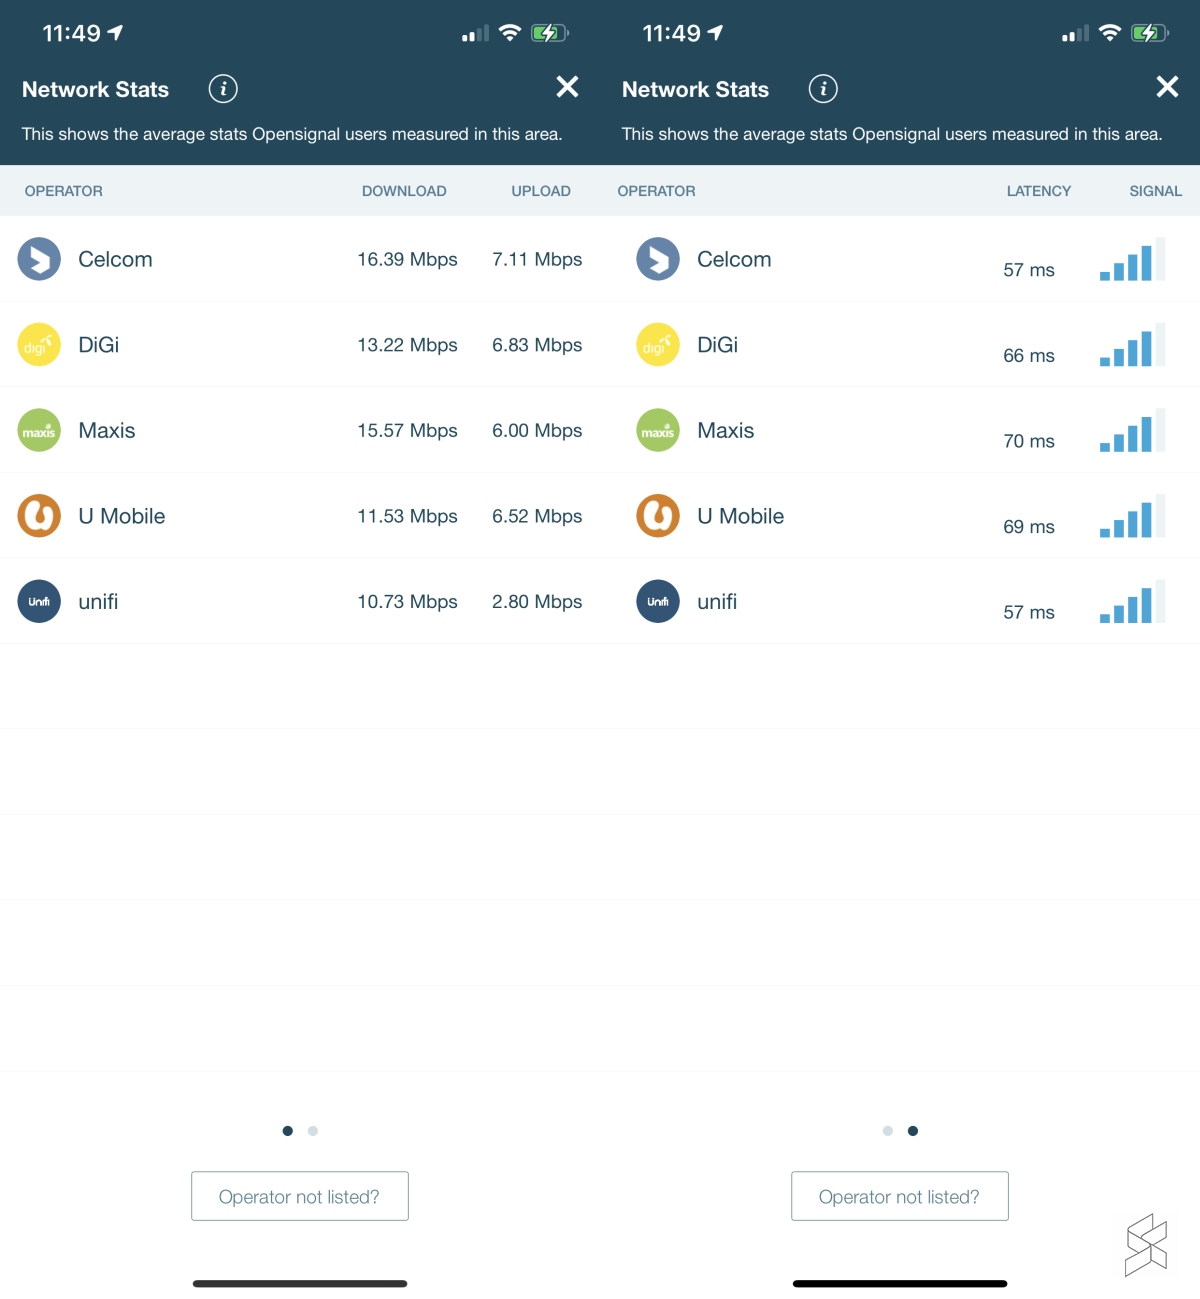
As a comparison, Opensignal map offers more information such as average download and upload speeds as well as latency for each telco based on location. The good thing about Opensignal is that it uses crowdsourced data from its users. The network performance data is recorded in the background and not just when users run a speedtest.
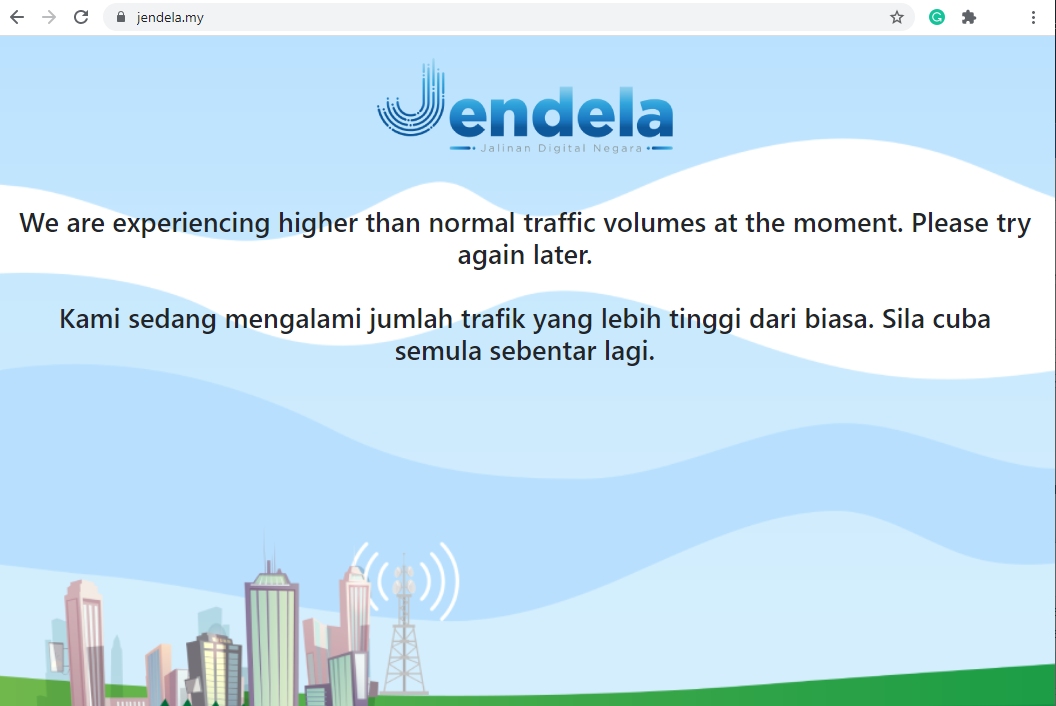
After the MCMC announced the JENDELA Map this afternoon, we can’t seem to load the map at the time of reporting. The website is still down with a message that it is experiencing higher than normal traffic.

